- Samantha's Newsletter - Around the Inlet
- Posts
- Cities with Casinos Pay Less
Cities with Casinos Pay Less
Why this is a problem for everyone else

Photo by Michał Parzuchowski on Unsplash
We are in the 2026 budget season, and I wanted to revisit gaming revenue sharing and the relationship to property taxation. I have previously written about advocating for gaming revenue sharing (here is one post on Facebook). Unlike neighbouring cities that receive millions in annual casino revenue, Port Moody has no access to this funding source—even though our residents spend about $600 per person on gaming each year. With the support of Council and staff, I’ve been advocating for a more equitable, province-wide sharing of gaming revenue so all communities, not just those with casinos, can benefit. As municipalities face more financial pressures and few tools to raise revenue, we need alternatives.
In that post, I was responding to a graphic showing the 2025 proposed tax increases as of December 2024. At that time, Port Moody’s was 8.5% (ultimately, Council whittled that down to 5.7%). One of the comments asked that I look at the relationship between tax increases and compare communities with casino revenue to those without. I was interested in seeing if there was a relationship; I thought this may be a tenuous connection, given the many factors that go into setting the property tax rate (and, by extension, the percent increase it results in). Our CFO constantly reminds us that it is difficult to compare municipalities directly - it is not an apples-to-apples comparison; a 1% percent tax increase in one municipality does not generate the same tax dollars as a 1% tax increase in another. Percentages are also an abstract construct, which, without context, is hard to understand what it means to households. The media tends to focus on the percentage increase and not the dollar cost.
Some municipalities have parcel taxes (levies on all properties that don’t take into account income or property value) to pay for amenities, some collect money for reserves (helps with planning), some have more industrial land base, some use development revenues to offset taxes, some include utilities in the percentage increase, some transfer more costs to utilities than others and some do not, and many other factors. In short, it can be hard to compare.
The City includes this video on its website to help explain how annual assessed values are incorporated into the tax rate calculation. Key point: if you see a city’s tax rate increase 9% it does not mean your taxes will increase 9%. The video helps to clarify things. Watch it here:
I understand taxes are a passionate topic, and it’s important for us all to be on the same page about tax fairness, so I have tried to provide a comparison and some analysis (though I am sure the City’s CFO is shaking his head at me - sorry, Paul!). I’ve used publicly available information - helpfully collated by the Province. I am comparing the municipal portion only for residential properties (Class 1), which does not include school, regional district, utilities or parcel taxes (e.g., in past years, Surrey has applied a parcel tax of approximately $200, which is not included in their property tax rates), so tax rates may appear artificially low for some communities. The province helpfully normalizes these on a per capita basis, taking the total assessed value of all residential properties, multiplying by the Class 1 tax rate and dividing that by population. These are the values that I have used for comparison from 2005 to 2025.
Background on Casino Revenue
Typically, the host community receives 10% of net casino revenues (except the Town of View Royal, which shares the revenues received with neighbouring municipalities). The province initiated revenue sharing as a way to incentivize communities to host casinos. Initially, it was expected that sharing the revenue would be a way to offset anticipated social and other costs in the host cities associated with hosting. Still, as the Province wrote in response to a 2008 UBCM resolution submitted by Port Coquitlam, negative impacts have not been experienced:
“The current revenue sharing being undertaken with local governments hosting casino gaming was originally established to help those communities offset the infrastructure, social service and other costs related to hosting a gaming venue. By all accounts, most communities have experienced minimal, if any, negative financial consequences as a result of hosting such a facility and are using the revenue they receive for other, locally determined priorities.”
This results in host communities having access to significant revenues to offset the financing of the important infrastructure projects or community amenities we all need to provide to deliver our critical services. For example, “in 2024, the City of Langley allocated its share of provincial gambling revenue toward several municipal projects. This included $2.8 million for the acquisition of land for future municipal buildings, $2.8 million for the purchase of a new Fire Ladder Truck, and $2.5 million for infrastructure improvements.”1 In contrast, a similarly sized city like Port Moody has to either use debt financing to purchase a ladder truck or use reserves (which are paid back through taxation) for land acquisition or other infrastructure projects like water and sewer. | Metro Vancouver municipalities with casinos:
|
In 2025, the City of Langley’s planned allocations include $4.9 million for replacing water and sewer infrastructure and $1.9 million for upgrading roads, sidewalks, and multi-use paths. This is expected to be funded by 10% of the net casino revenue the city receives annually.
Consolidated gaming revenue reports from the Province of BC are only available up to 2021/22. You can find that here. However, I was able to find information on taxes paid to host communities, the share of revenues to local hosts and information on the amount and number of Community Gaming Grants provided in the fiscal year 2024/25 (links available in the References section). Additionally, there is information on how the host community uses some of the gaming revenue - many projects are infrastructure-related.
BC Lottery Corporation (BCLC) most recently published a report on the economic impact on the City of Kamloops. BCLC headquarters are in Kamloops, but the report splits out the total Host Local Government transfers for the two Kamloops casinos, Cascades Casino and Chances Kamloops. From FY 1999/2000 to FY 2024/25, the City of Kamloops has received $73.9 million.
The report estimates BCLC’s Total 40 Year Cumulative Economic & Social Impact over the past 40 years (from FY 1985/86 to 2024/25). In that time period, BCLC has contributed approximately $3 billion to the community of Kamloops because of its economic impact and for its support of social programs.
So, let’s first look at the most recent data from casinos in Metro Vancouver.
How we examine revenue
To test whether gaming revenue correlates with lower residential tax burdens, I compiled publicly available tax data for 21 Metro Vancouver municipalities from 2005 to 2025. Electoral Area A and Tsawassen First Nation are excluded, though they are members of the Metro Vancouver Regional District.
The most recent data available in one document, titled Local Government Share of Provincial Casino and Community Gaming Centre (CGC) Revenue, is for the fiscal year ending March 31, 2022, but individual Community Impact Reports provide this information for each community. Community Impact Reports also include total gambling revenue shares, taxes paid in the last fiscal year and the amount transferred to community organizations through the Community Gaming Grants program. Links are provided in the table; see the Reference section.
Tax data is from BC Government’s Local Government Statistics: Municipal tax rates and tax burden (accessed October 18, 2025).
Results
Let’s first look at the benefit that municipalities receive from transfers of gaming revenue. Gaming revenue can be transferred to the community in three ways:
Revenue sharing agreements with casino host communities (direct),
Property taxes received from casinos to host cities (direct), and
Community Gaming Grants to all local organizations (indirect).
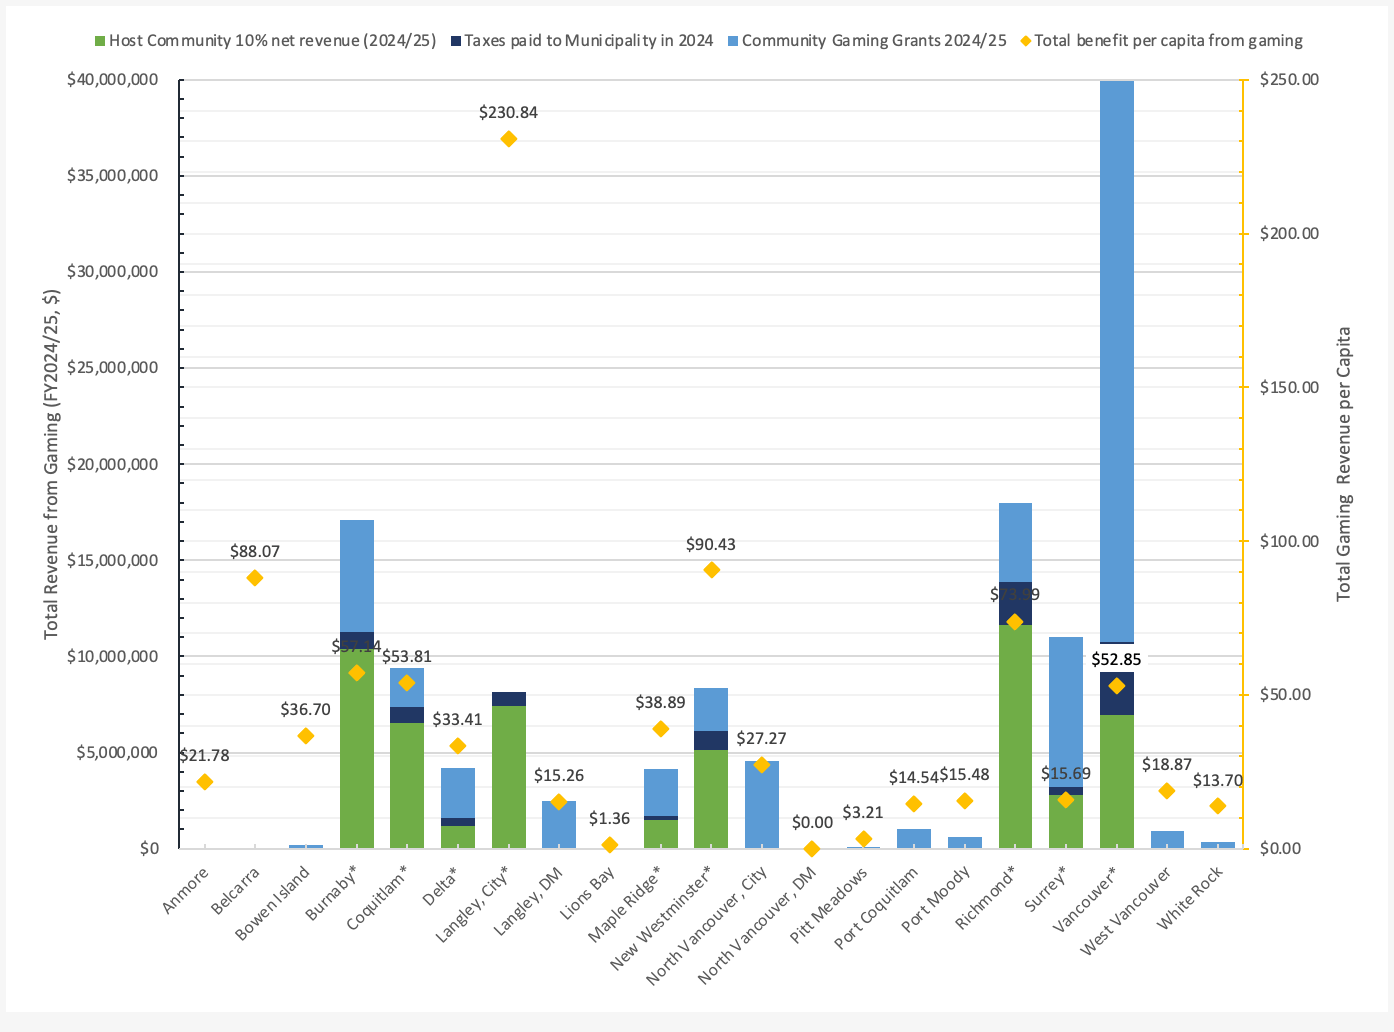
I’ve defined total benefit as the sum of property taxes paid by the casino, the 10% net proceeds and the total Community Gaming Grants received by local organizations.
Generally, communities that host casinos have a per capita total benefit above the median value. I’ve divided the total benefit by the population of each municipality to find the amount of dollars per person that the community receives from all sources of gaming revenues. I did not include lottery or scratch and win tickets as I consider that a personal benefit rather than a community benefit.
The chart below shows that municipalities with a casino get at least the average amount of $33.41 per person, with up to $90.43 per person in New Westminster. Belcarra (no casino) stands out because in 2024, one group received a large grant. The City of North Vancouver also had community groups that received larger-than-normal grants in 2024. Watching how these grants are distributed over time would help us better understand how gaming grants support community groups and if it is being shared fairly.

Chart Notes:
Communities with * indicate municipalities that host casinos.
BCLC does not distinguish between the City of Langley and the Township of Langley for Community Gaming Grants. For this analysis, I have allocated all gaming grants to the Township.
BCLC does not distinguish between the District and City of North Vancouver so I have allocated all the Community Gaming Grants to the City. The per capita amount includes the District population.
Population estimates are from BC Population Estimates https://www2.gov.bc.ca/assets/gov/data/statistics/people-population-community/population/pop_municipal_subprov_areas.xlsx
But how does this relate to taxation?
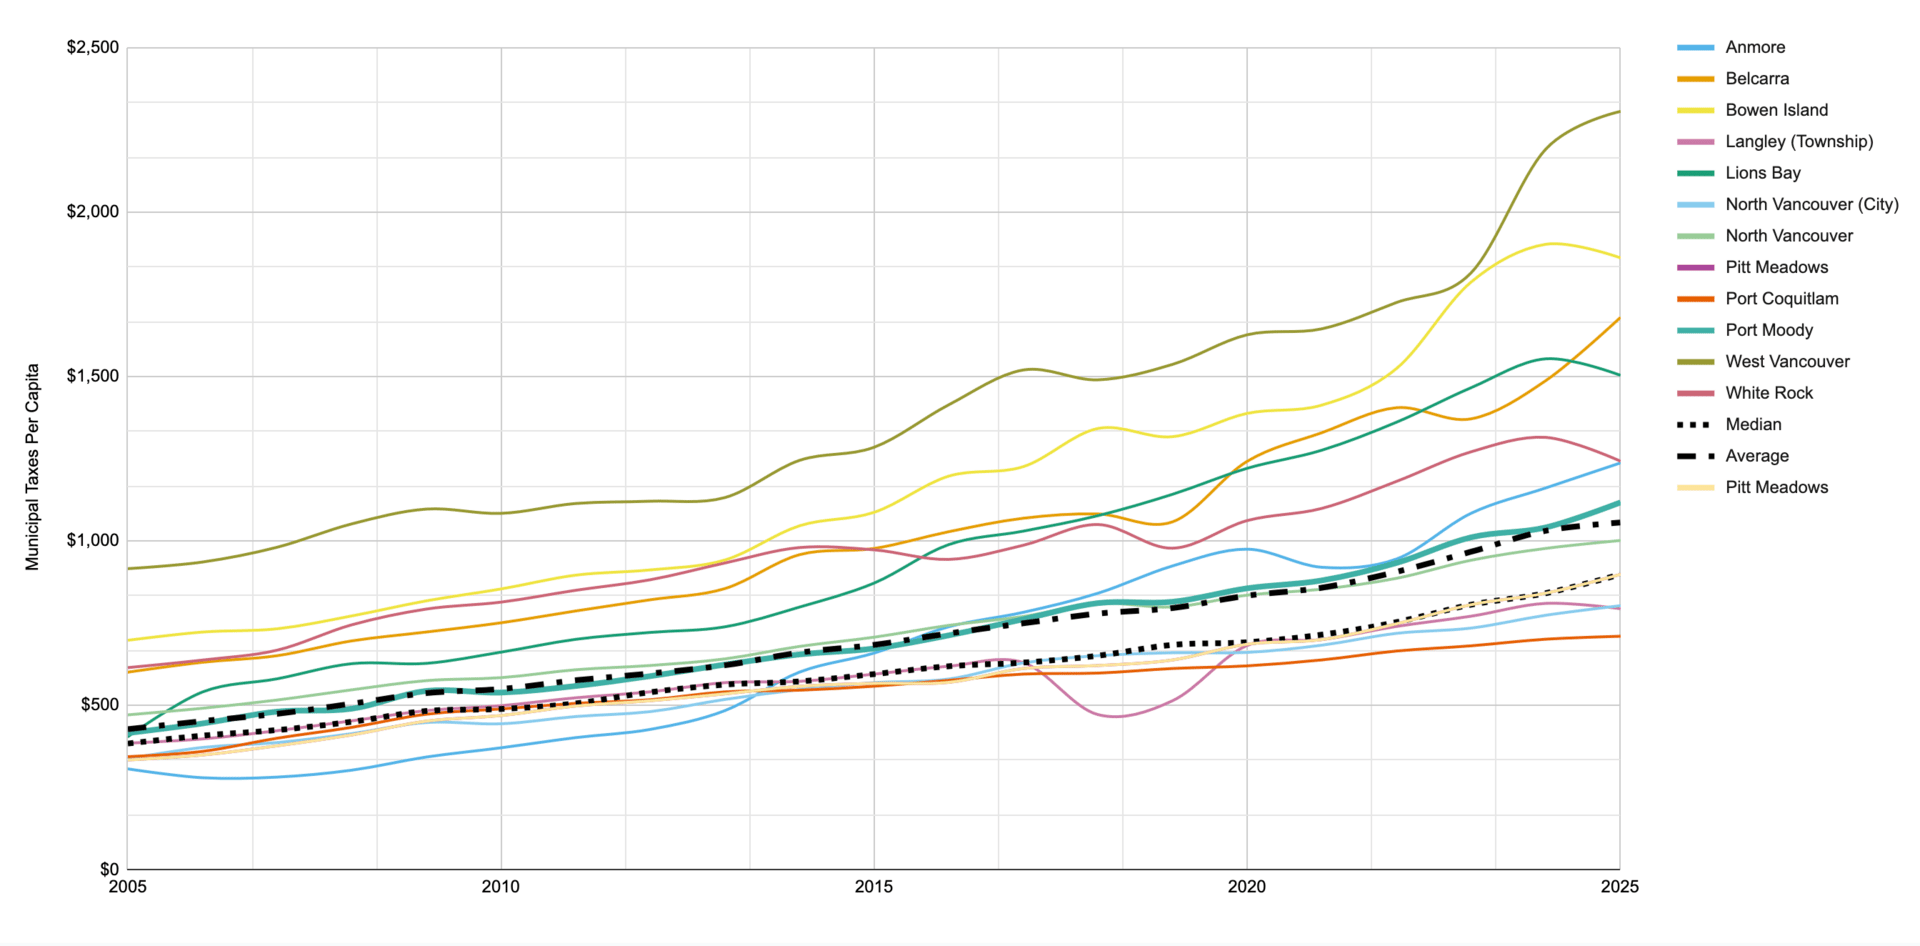
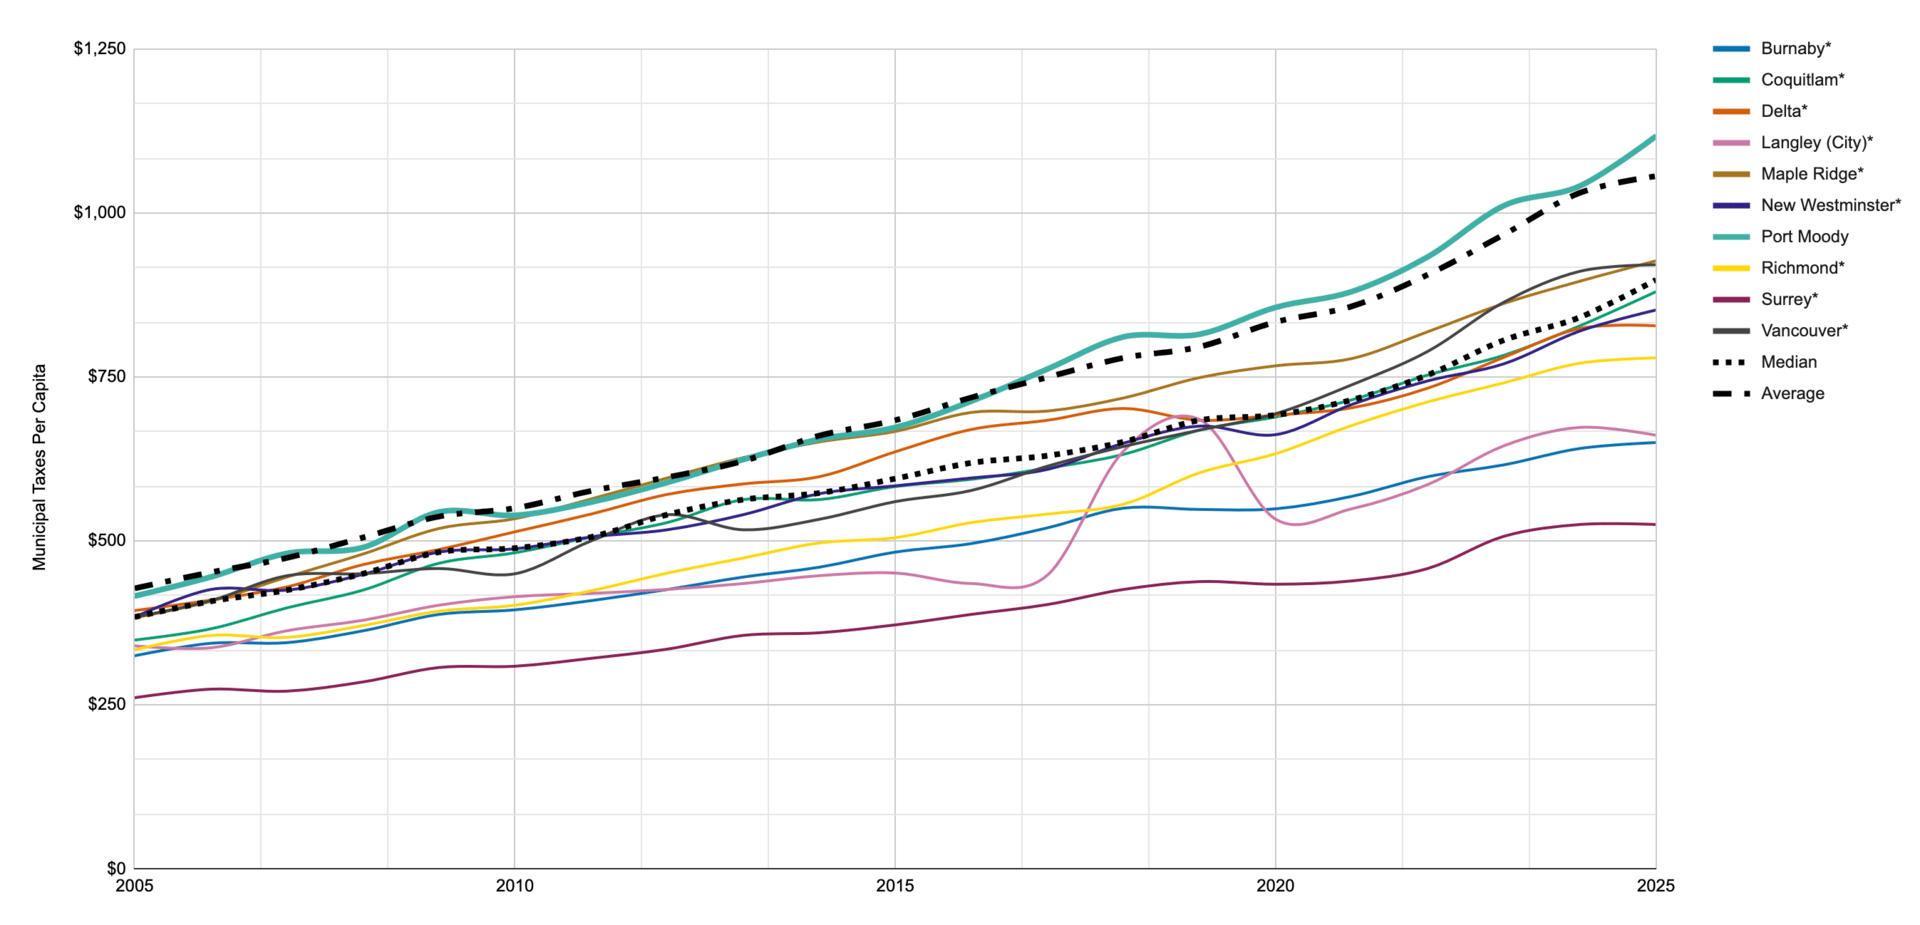
Using the Municipal Tax Burden, Schedule 707 data from 2005 to 2025, I plotted the Municipal Taxes Per Capita (Class 1 - Residential) amounts along with the median and average of all 21 municipalities.
The first chart shows all municipalities. On the chart, you’ll see Port Moody (teal line) tracks closely to the regional average, while host communities have typically trended below it. Municipalities with * have casinos. While this chart is a little busy, it clearly provides an overall picture of the range of values.

Here is a simpler version with just the highest and lowest values per year, along with median and average lines. Port Moody is added for reference. All other municipalities have been removed.

The next chart shows all the municipalities without a casino (five with moderately lower per capita rates, six with higher rates when compared to Port Moody).

And here are the municipalities with a casino, compared to Port Moody. In this case, municipalities with casino revenue and casino property tax are all below the average for the region.

Conclusion
Casino revenue and property taxes from those properties appear to help keep taxes lower for municipalities that host them. As municipalities continue to grapple with infrastructure and affordability pressures, a more equitable sharing of provincial gaming revenue could help ensure fairness across BC – not just for those fortunate enough to host a casino.
Many host cities have argued that they do not incorporate their casino revenues into their base budgets but use them for capital projects. Therefore, there is no property tax rate relief from that perspective. However, most costs cities incur do have a direct or indirect impact on city finances, which eventually work themselves back to the host city, having to spend less tax dollars, whether it is transferring less to capital reserves or lowering asset levies.
As seen in the City of Langley example, this revenue provides significant benefit to host communities, allowing them to purchase land, invest in their infrastructure and otherwise improve community amenities without adding to the tax burden.
Communities like Port Moody, that don’t have this financial option, end up shouldering the full cost through taxation. In past conversations with provincial ministries, this inequity has been acknowledged, but the message we’ve received is consistent: until a motion passes UBCM and there is support from the vast majority of communities without gaming revenue, the Province is not prepared to prioritize this initiative.
The Province, at this point, is not interested in leading a remedy for the inequity despite creating the issue in the first place (albeit inadvertently). What is frustrating to me is the lack of collective advocacy from non-host municipalities. A fairer system of gaming revenue sharing would benefit us all, certainly Port Moody. There are only 33 communities that host a gambling facility. There are 162 municipalities in BC.
If the Province suddenly distributed other funding, like traffic fine revenue, in an inequitable manner, most cities would be outraged. Casino revenues have slowly crept into host city budgets and are not available to non-host communities, so the inequitable sharing seems to fly below the radar.
At its core, this topic is not just about numbers or how much we pay in property tax; it is about fairness. The current system benefits a small number of host communities while leaving others to shoulder the same responsibilities with fewer tools.
This is not the municipal way; we pool revenues and share costs on everything else from MIA, to MFA, to gas tax, Growing Community Funds, to traffic fines and on and on. Municipalities without casinos still provide all the same essential services – policing, fire protection, recreation, and infrastructure that serve both local residents and people from across the region. Yet we don’t share the same revenue sources. Over time, this creates an uneven playing field where geography (or first in), rather than good governance, determines fiscal capacity. Let’s be real, we cannot have casinos in every municipality.
A more equitable approach to gaming revenue sharing would recognize that all communities contribute to the province’s economic and social fabric, including the money residents spend on gaming, whether that is in a casino, sports betting, or on the lottery. We should all share proportionately in its benefits. Until that changes, some communities will continue to carry more than their fair share of the burden. And this is a problem for 128 communities without access to this revenue source.
Final Thoughts
Within Port Moody boundaries, several property tax revenue sources are limited by the Province. Port properties (Class 4 - Heavy Industry) are capped at $27.50 per $1,000 of assessed value. Hospitals do not pay property taxes (though they do pay school taxes), and recently BC Hydro appealed – and won – the reassessment of the Burrard Thermal site, resulting in approximately $300,000 less revenue for the city – roughly equivalent to a 0.5% tax increase in 2026.
At the October 28 meeting, Council voted to increase the Utilities tax rate to the maximum of $40 per $1,000 of assessed value. We are also writing to the Province about equitable sharing of gaming revenue (not taking money from casino communities), and are exploring filing a complaint with the BC Ombudsperson.
Meanwhile, we are still waiting for their share of the cannabis excise tax that was promised to those who allow retail cannabis stores.
For those who think Port Moody should have just taken a casino when we had the chance - that ship has sailed. And if we did, it would only mean another community would miss out. It’s ridiculous to think that every municipality could host a casino. The province can spare a little from the $1.4 billion in gaming revenue it collected last year.
‘What’s played here, stays here’? Great slogan. Terrible policy. Fairness shouldn’t be left to chance.
References
The Mayor of New Westminster, Patrick Johnstone, has written extensively on the tax subject - you can read his thoughts here: https://www.patrickjohnstone.ca/tag/taxes. His blog is a good read (there are multiple posts with a lot of analysis, thanks, Pat!).
2008 UBCM resolution submitted by Port Coquitlam: https://www.ubcm.ca/convention-resolutions/resolutions/resolutions-database/lottery-corporation-revenue-sharing
2024 UBCM Equitable Distribution of Gaming Revenue, submitted by Port Moody: https://www.ubcm.ca/convention-resolutions/resolutions/resolutions-database/equitable-distribution-gaming-revenue
BC First Nations Gaming Revenue Sharing and Financial Agreement: https://static1.squarespace.com/static/5c64b80baadd3451b2b47ee1/t/5cfb041798f3530001997aca/1559954456264/2019.06.06+Backgrounder+on+BC+Gaming+Revenue+Sharing+Model.pdf
Four Decades of Economic and Social Impact (1985–2025) of the British Columbia Lottery Corporation in Kamloops: https://corporate.bclc.com/content/dam/bclccorporate/reports/community-impact-reports/economic-social-impact/bclc-kamloops-economic-report-2025.pdf
BC Government, Local Government Statistics, Municipal tax rates and tax burden: https://www2.gov.bc.ca/gov/content/governments/local-governments/facts-framework/statistics/tax-rates-tax-burden
BC Population Estimates https://www2.gov.bc.ca/assets/gov/data/statistics/people-population-community/population/pop_municipal_subprov_areas.xlsx
Municipal Tax Burden, Schedule 707: https://www2.gov.bc.ca/gov/content/governments/local-governments/facts-framework/statistics/tax-rates-tax-burden
Community Gaming Grants, Fiscal 2024-25 Year End Grant: https://www2.gov.bc.ca/assets/gov/sports-recreation-arts-and-culture/gambling/grants/year_end_report_cgg_grant_payments_by_community.xlsx?forcedownload=true
Community Impact Report - Burnaby: https://corporate.bclc.com/content/dam/bclccorporate/reports/community-impact-reports/2025/community-impact-report-2024-25-burnaby.pdf
Community Impact Report - Coquitlam: https://corporate.bclc.com/content/dam/bclccorporate/reports/community-impact-reports/2025/community-impact-report-2024-25-coquitlam.pdf
Community Impact Report - Delta: https://corporate.bclc.com/content/dam/bclccorporate/reports/community-impact-reports/2025/community-impact-report-2024-25-delta.pdf
Community Impact Report - Langley: https://corporate.bclc.com/content/dam/bclccorporate/reports/community-impact-reports/2025/community-impact-report-2024-25-langley.pdf
Community Impact Report - Maple Ridge: https://corporate.bclc.com/content/dam/bclccorporate/reports/community-impact-reports/2025/community-impact-report-2024-25-maple-ridge.pdf
Community Impact Report - New Westminster:
Community Impact Report - Richmond:
Community Impact Report - Surrey:
Community Impact Report - Vancouver: https://corporate.bclc.com/content/dam/bclccorporate/reports/community-impact-reports/2025/community-impact-report-2024-25-vancouver.pdf
1 Langley Community Impact Report, 2024/25, https://corporate.bclc.com/content/dam/bclccorporate/reports/community-impact-reports/2025/community-impact-report-2024-25-langley.pdf